IBM Connections Pink - Visualise your log files
I had the pleasure to attend the “IBM Connections Pink Developer Briefing” last week in Dublin and I have to say it was the best IBM Workshop ever!
You can find more info on that event on Daniele Vistalli’s post on Linkedin.
During the workshop we looked at OrientMe, the first Pink feature in IBM Connections 6 and how it is deployed to “IBM Spectrum Conductor for Containers” (from now on CfC).
We had a session on Monitoring and Troubleshooting and surprise, surprise, IBM is using “Telegraf, InfluxDB & Grafana” for real time resource monitoring and the ELK stack for log management.
Filebeat, Logstash and Elasticsearch is installed per default (and curator for deleting old log files as well) , only Kibana is missing to visualise the log files.
Of course my first task after this session was to setup a Kibana container which gathers the data from elasticsearch. Want to do this on you CfC?
-
SSH into your CfC Worker
-
look for the running elasticsearch container (docker ps | grep elasticsearch)
-> you should find a container with ibmcom/elasticsearch:2.4.1 as Image
-
run your Kibana container on the worker node (I use Version 4.6 because CfC is using elasticsearch 2.4.1 which isn’t supported by the newest Kibana version):
docker run -name wgc-kibana -e ELASTICSEARCH_URL=http://yourWORKERcfcHOSTNAME:9200/ -p 5601:5601 -d kibana:4.6
-
you can now directly access Kibana: http://yourWORKERcfcHOSTNAME:5601
The Filebeat container is configured to get docker log files from /var/log/containers/docker/*.log -> tagged as docker and kubernetes log files from /var/log/containers/*.log tagged as k8s-app
I plan to create some searches, visualisations and dashboards in future and of course will share them with the community, so stay tuned!
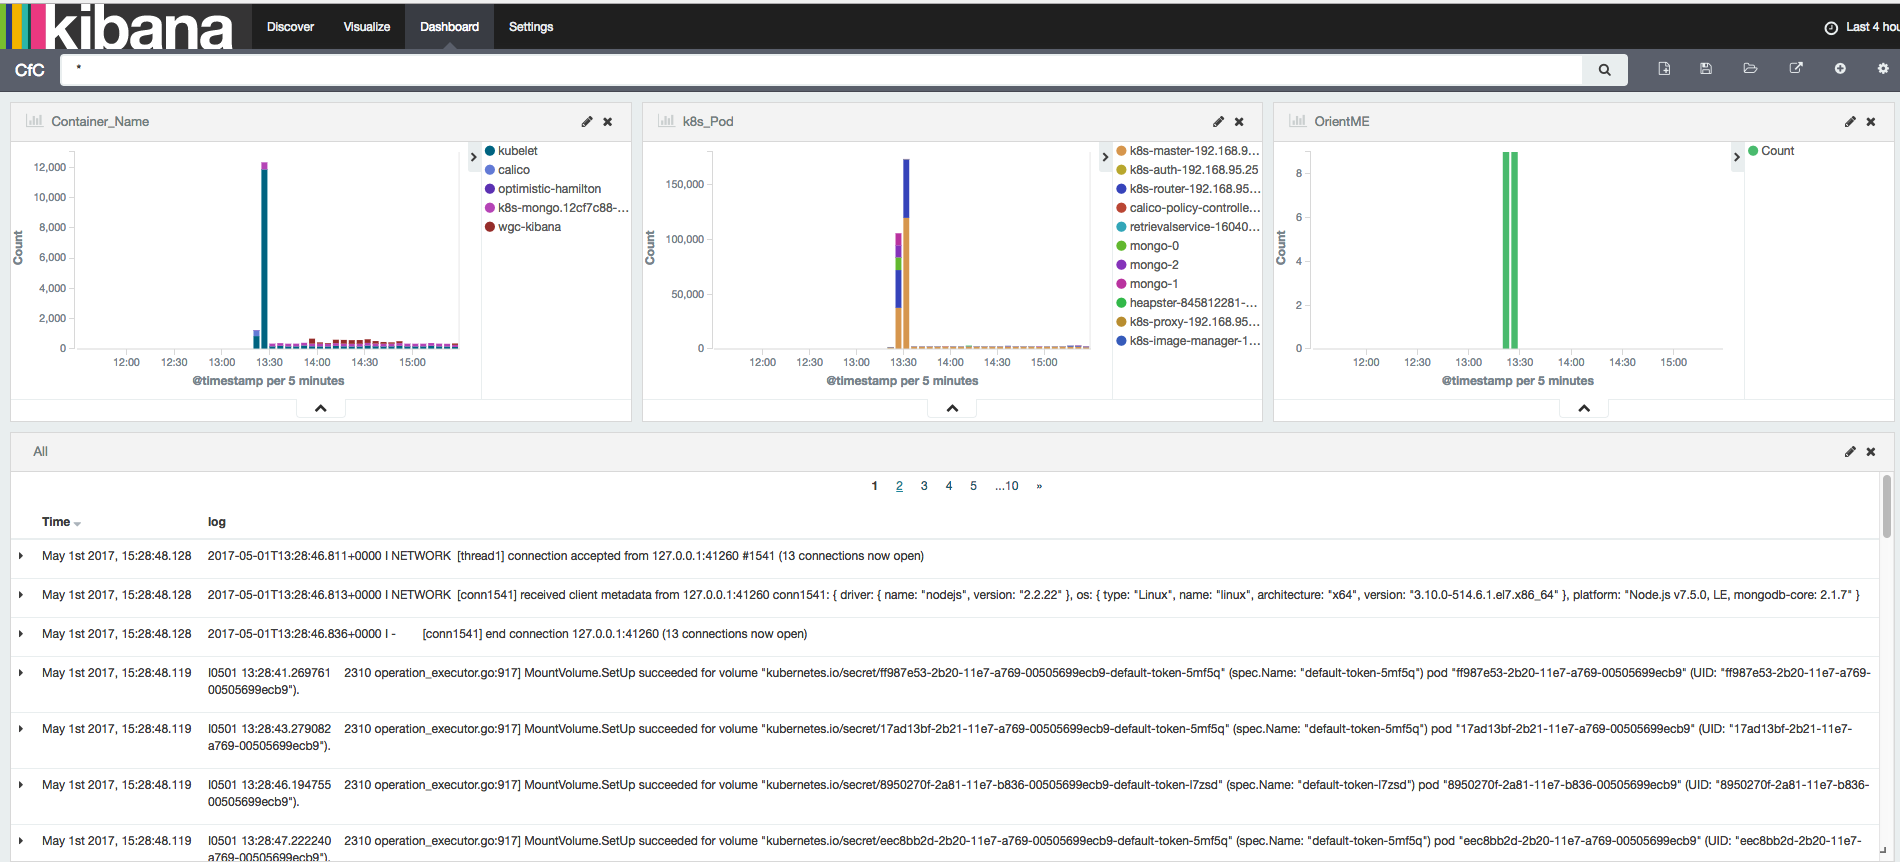
Screenshot from a first sample dashboard: