Monitor WebSphere with ELK and Nagios
Worked a lot with the ELK stack for log management and Nagios for system monitoring in the last months and like both solutions a lot.
They are very flexible and customizable to match almost every customer environment. So the natural next step was to combine both solutions to build a very powerful system monitoring and management solution for WebSphere servers (IBM Connections/IBM Sametime).
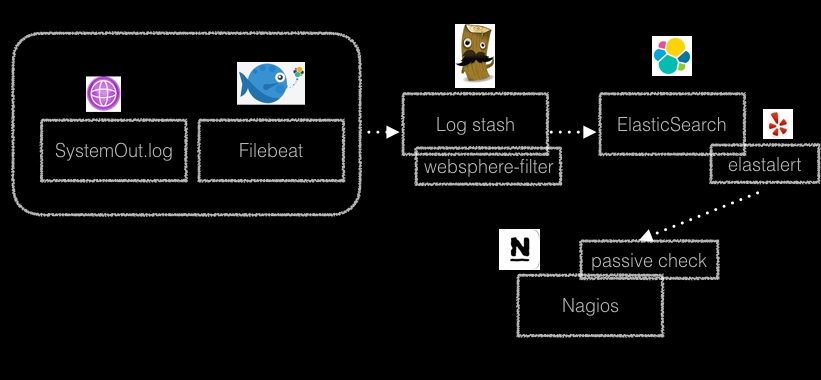
- Filebeat acts as shipper on the WebSphere server and sends all SystemOut.logs to LogStash
- LogStash server uses a websphere filter to process the log messages and to cut them into fields
- LogStash sends the log messages/fields to ElasticSearch
- Elastalert analyzes the WebSphere messages/fields in the ElasticSearch DB (frequency, spikes, blacklist…) and sends alerts to Nagios
- Nagios gets notified through a passive check
Nice side effect is that I have all my WebSphere logs in the ElasticSearch DB and I can visualize the data with Kibana.
I will try to cover the involved steps through some blog posts in the near future. Please leave a comment if you are interested in a particular step which I should address first.